INVITE-ONLY SCRIPT
Quintalytics TrailingStop MultiTime

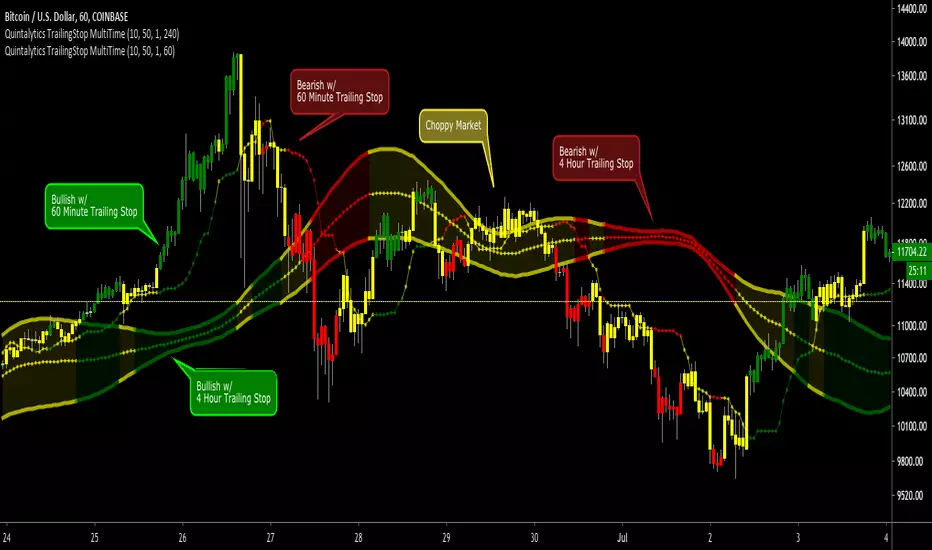
Quintalytics TrailingStop MultiTime is a combination of a Trend, Sideways/Chop Detection, and Trailing Stop Loss indicator.
This indicator is suitable for use in all timeframes and markets.
The Multiple time Frame function allows for the TrailingStop to be Calculated from another timeframe and shown in the current chart.

For Example:
4 Hour TrailingStop line on a 60 Minute Chart
Daily TrailingStop line on a 4 Hour Chart
15 Minute TrailingStop line on a 5 Minute Chart
COLORS
The Color GREEN indicates the presence of a Bullish Trend.
The Color RED indicates the presence of a Bearish Trend.
The Color YELLOW indicates that the market is Sideways a.k.a. Flat a.k.a. Choppy.
You have the option of COLORING the BAR to match the current TrailingStop color.
You have the option of applying a Smoothing to the TrailingStop line.
You have the option of showing a Standard Deviation Band based on the TrailingStop line.
SETTINGS
The indicator has seven parameters:
1. Lookback - # of previous bars used to calculate the trailing stop
2. Std Dev Lookback - # of previous bars used to calculate the Standard Deviation
3. Std Dev X – Multiplier of Std dev. i.e. 2 = 2x Std Dev of the TrailingStop line
4. Color Bar? – toggle Coloring of the Candlestick/Bars on the chart
5. Show Std Dev? – toggle showing the Std Dev bands.
6. Smooth? – toggle Smoothing the TrailingStop line
7. Timeframe - Select the time frame used to calculate the TrailingStop (1 Hour, 4 Hours, 1 Day, 1 Week, etc.)
Changing these settings individually or in combination will yield varying results.
2 Alerts are provided with the indicator: CLOSE OVER STOP line and CLOSE UNDER STOP line
This indicator is suitable for use in all timeframes and markets.
The Multiple time Frame function allows for the TrailingStop to be Calculated from another timeframe and shown in the current chart.
For Example:
4 Hour TrailingStop line on a 60 Minute Chart
Daily TrailingStop line on a 4 Hour Chart
15 Minute TrailingStop line on a 5 Minute Chart
COLORS
The Color GREEN indicates the presence of a Bullish Trend.
The Color RED indicates the presence of a Bearish Trend.
The Color YELLOW indicates that the market is Sideways a.k.a. Flat a.k.a. Choppy.
You have the option of COLORING the BAR to match the current TrailingStop color.
You have the option of applying a Smoothing to the TrailingStop line.
You have the option of showing a Standard Deviation Band based on the TrailingStop line.
SETTINGS
The indicator has seven parameters:
1. Lookback - # of previous bars used to calculate the trailing stop
2. Std Dev Lookback - # of previous bars used to calculate the Standard Deviation
3. Std Dev X – Multiplier of Std dev. i.e. 2 = 2x Std Dev of the TrailingStop line
4. Color Bar? – toggle Coloring of the Candlestick/Bars on the chart
5. Show Std Dev? – toggle showing the Std Dev bands.
6. Smooth? – toggle Smoothing the TrailingStop line
7. Timeframe - Select the time frame used to calculate the TrailingStop (1 Hour, 4 Hours, 1 Day, 1 Week, etc.)
Changing these settings individually or in combination will yield varying results.
2 Alerts are provided with the indicator: CLOSE OVER STOP line and CLOSE UNDER STOP line
Invite-only script
Access to this script is restricted to users authorized by the author and usually requires payment. You can add it to your favorites, but you will only be able to use it after requesting permission and obtaining it from its author. Contact quintalytics for more information, or follow the author's instructions below.
TradingView does not suggest paying for a script and using it unless you 100% trust its author and understand how the script works. In many cases, you can find a good open-source alternative for free in our Community Scripts.
Author's instructions
″
Want to use this script on a chart?
Warning: please read before requesting access.
Disclaimer
The information and publications are not meant to be, and do not constitute, financial, investment, trading, or other types of advice or recommendations supplied or endorsed by TradingView. Read more in the Terms of Use.