AtlaStar
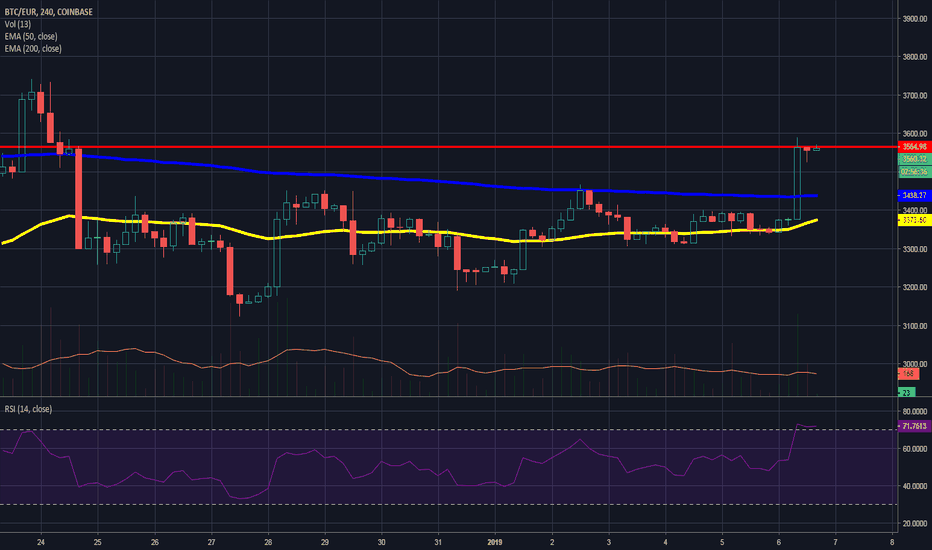
For those who are calling this recent pump the beginning of a Bart formation, you need to see you this.
Currently looking as if we are going to form a diagonal triangle formation. Make sure to look for an ABC subwave for wave 3 and 4 before assuming that this is actually a 3-3-3-3-3 pattern as wave 2 is not clear. If confirmed on wave 5, we will likely see a strong corrective wave and possibly a continuation of the previous bear market. Will need to confirm first...
Apparent Elliot Wave formation. If wave's 2 and 4 actually tested the Fib retrace zones, price target will be above 4k. Also including a chart of the subwaves on 30 minute view which all appear to be valid Elliot waves which leads me to believe that this is a proper wave formation. EDIT: I mispoke in my comment...wait for wave 3 and 4 on the 30m chart to test...
Very clear divergence on the 15 minute chart, as well as hidden and normal bearish divergence on the 5m charts. Make sure to look for other indicators to confirm.


